Bitcoin is down roughly 40% in mid-2026 while stocks, gold, silver and foreign markets print new all-time highs — and the reason why Bitcoin is down while stocks are up has almost nothing to do with Bitcoin itself. Investor Mark Moss argues the asset isn’t broken and isn’t being manipulated; the money simply slid back along the risk curve toward AI, pulled by one force: real yields.
That framing matters because it hands you a signal to watch instead of a story to panic over. When real yields turn, the same force that drained capital out of Bitcoin reverses and pushes it back.
Key takeaways
- The two popular explanations are both wrong, per Mark Moss: Bitcoin hasn’t “finally popped” like a tulip bubble, and it isn’t being naked-shorted by BlackRock or China.
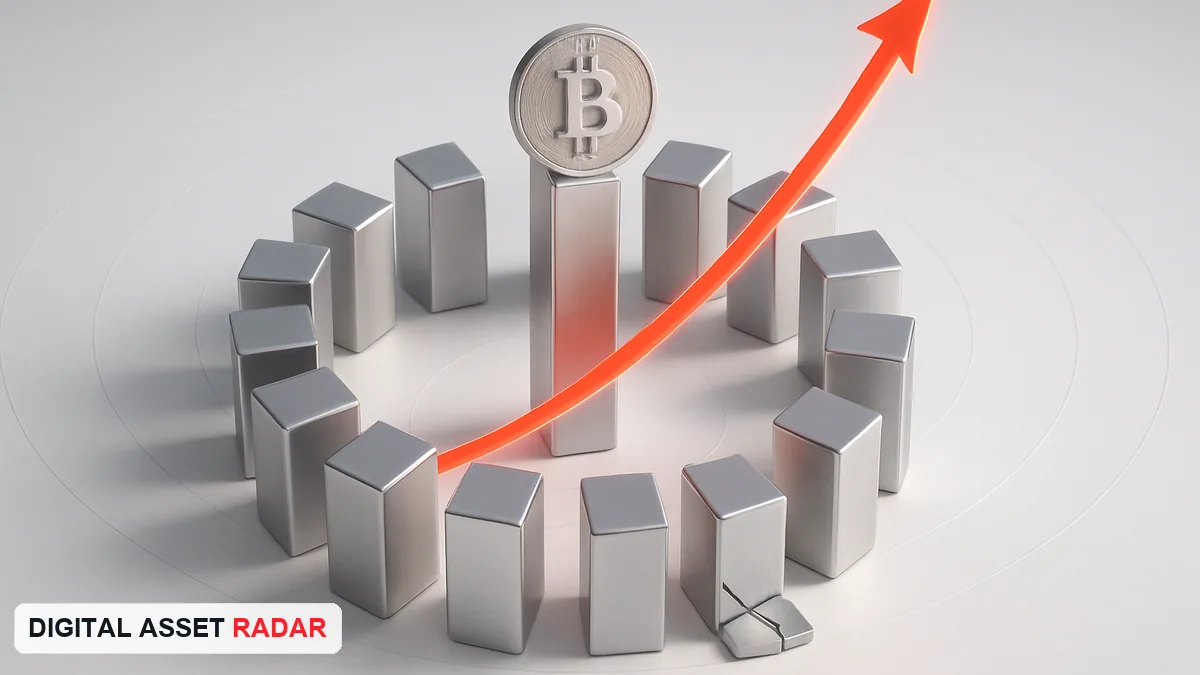
- Every asset sits on a risk curve from safe/low-return (T-bills, bonds) to risky/high-return (AI stocks, then Bitcoin), and capital only travels as far out as it must.
- Real yields are the master switch. With inflation near 3.8% and Treasuries paying about 3.8%, safe money can sit still — so it does, starving the far end of the curve.
- US debt interest is compounding parabolically, forcing rates lower over time; falling rates create negative real yields that historically push money back toward Bitcoin.
- The four-year cycle amplified the drop. Moss dates the peak to October 2025 (about 18 months after the halving), so 2026’s weakness fits the pattern rather than breaking it.
Why is Bitcoin down while stocks are up? The risk curve, not the coin
Bitcoin has been the best-performing asset in roughly eight of the last 12 years, Moss notes — yet in mid-2026 it is getting its worst relative beating in years. The two explanations flooding the timeline both fail his test.
The bearish camp, personified by longtime skeptic Peter Schiff, says the bubble has finally burst. But Bitcoin has been declared “dead” hundreds of times across mainstream media since 2010, each obituary clustering at a price low and each one wrong. The bullish camp says a boogeyman — BlackRock, Michael Saylor’s strategy, China, “paper Bitcoin” — is suppressing the price. Moss calls both takes coping: price tells you what is happening, not why.
His mechanical explanation starts from a single idea: money behaves like energy. It is not created or destroyed when an asset falls; it transfers somewhere else. If it left Bitcoin, it went somewhere — and it can come back.
Understanding the risk curve
Picture a continuum. On the left: safe, low return. On the right: risky, high return. Every asset lands somewhere on that line.
- Government bonds sit near the safe end, paying roughly 3–3.5%.
- Gold and blue-chip dividend stocks come next.
- AI stocks sit further out — riskier, but backed by real companies with cash flow.
- Bitcoin sits near the far end: no cash flow, no company, highest risk and highest potential return.
Moss anchors this with five-year annualized volatility: cash and T-bills near 0.5%, government bonds around 6%, the S&P 500 about 16%, Nvidia (his proxy for the AI trade) at roughly 52%, and Bitcoin at about 75%. Bitcoin and AI cluster together at the volatile end, far above the safe assets — which is exactly why they compete for the same speculative dollars.
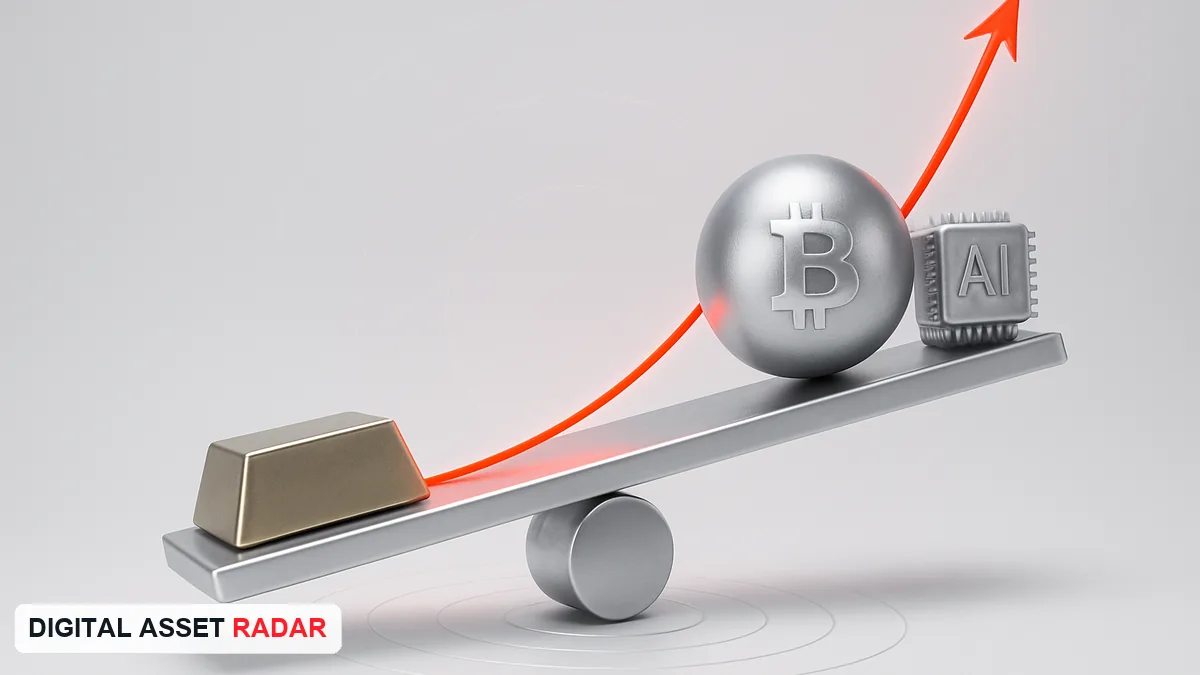
The engine that moves money along this line is a simple question professional allocators ask constantly: how much risk do I need to take? You take only as much as the return requires. When safe assets pay well, money stays safe. When safe yields collapse — as they did during the zero-rate era — money is forced out along the curve to hunt for return. Right now, AI offers more upside than bonds with less risk than Bitcoin, so capital rotated one seat back, from Bitcoin toward AI. This mirrors the AI supercycle pulling compute, energy and crypto capital together.
Real yields are the switch — and government debt is flipping it
So what moves the money back? Real yields: the gap between what safe assets pay and inflation.
With inflation near 3.8% and Treasuries yielding about 3.8%, the real yield is roughly neutral-to-positive — safe money can park in Treasuries and roughly keep pace with inflation. That “positive real yield” is why capital is content to sit at the safe end and leave Bitcoin starved.
Here is where Moss’s macro thesis kicks in. US federal interest payments on the national debt are rising not linearly but parabolically — one of the two largest line items in the federal budget, second only to Social Security and now ahead of defense and Medicare. The Congressional Budget Office (CBO) projects both debt and deficits blowing out through 2050, driven overwhelmingly by net interest. You can read the CBO’s long-term budget outlook directly to see the trajectory.
There are only two ways down: pay off the debt (not happening) or cut the interest rate on it. That, Moss argues, is the real reason rate cuts are coming — not politics, not a specific Fed chair. With Jerome Powell having left the Fed and Kevin Warsh incoming, Moss expects the inflation calculation itself to be loosened so it can run hotter while rates fall. Yields down plus inflation up equals negative real yields — where holding “safe” Treasuries quietly loses money to inflation.
The historical fingerprint of real yields on Bitcoin
Moss overlays Bitcoin against the 10-year TIPS real yield back to 2003, and the correlation is legible:
- 2020–2021: real yields near −1.1% (deeply negative). Bitcoin ran from about $9,000 to $46,000, roughly +400%.
- 2022: Powell’s fastest hiking cycle in history pushed real yields positive. Bitcoin fell from $46,000 to $17,000, about −64%.
- Oct 2023–Oct 2025: real yields positive (~+2%), yet Bitcoin surged from $17,000 to roughly $126,000, about +640% — because the four-year cycle was still in its bull phase and overrode the rate headwind.
- Oct 2025–mid-2026: real yields still positive near +2%, and with the cycle now past its peak, Bitcoin slid from about $126,000 to $75,000.
The lesson: real yields are the dominant tide, but the four-year halving cycle can amplify or override it. When both align against price — as now — you get the current drawdown. When real yields turn negative and the cycle turns up, the two forces stack.
Where 2026 sits in the four-year cycle
Moss dates the cycle peak to roughly 18 months after the halving — October 2025 — which places mid-2026 squarely in the bear phase. He notes the drawdown so far is milder than the 70–80% crashes of past cycles, even with fully positive real yields, and points to a recurring “three good years, one bad year” rhythm that would imply 2026 finishes stronger than it started.
Crucially, he refuses to trade the calendar. Markets don’t watch dates; they respond to conditions. The conditions to watch are real yields (rising or falling), the bond market’s read on debt, and inflation — the same variables behind the debate over whether Bitcoin’s four-year cycle is dead and the broader question of where the Bitcoin bottom sits.
The bottom line
The answer to why Bitcoin is down while stocks are up is not a failure of Bitcoin — it’s a rotation along the risk curve driven by positive real yields, with AI as the nearer, cheaper destination for speculative capital. Moss’s read is that unsustainable debt interest forces rates lower, real yields turn negative, and the money that behaved like energy flows back to the far end of the curve. Watch real yields and cycle timing, not the price ticker or the death headlines.
Frequently asked questions
Why is Bitcoin down while stocks are up in 2026?
According to investor Mark Moss, capital rotated back along the risk curve from Bitcoin toward AI stocks because safe Treasuries pay about 3.8% against 3.8% inflation, a roughly positive real yield. When safe assets pay enough, money doesn’t need to reach the risky far end of the curve where Bitcoin sits — so stocks and gold rally while Bitcoin lags.
What are real yields and how do they affect Bitcoin?
Real yield is the interest a safe asset pays minus inflation. When real yields are positive, money parks safely and Bitcoin tends to fall; when they turn negative, safe assets lose value to inflation and capital is pushed out the risk curve, which historically helps Bitcoin — as in 2020–2021 when real yields near −1.1% coincided with a roughly 400% rally.
Is Bitcoin being manipulated or is it broken?
Moss argues neither. “Bitcoin is dead” headlines have appeared hundreds of times since 2010 and been wrong each time, and the manipulation theory ignores a simpler mechanical explanation: money moved to AI because of real yields and the four-year cycle, and can flow back the same way.
Will Bitcoin recover in 2026?
No one can promise a date, but Moss’s framework points to a “three good years, one bad year” cycle rhythm and a 2026 that ends stronger than it started — provided real yields turn negative as rising US debt interest forces rate cuts. He stresses watching conditions (real yields, inflation, debt) rather than the calendar.